Industrial AI for Construction
Project overruns are pervasive and not improving.
Pirimid gives you the operational tools and systems to automatically find and fix issues in real-time unlocking 10%+ in lost value.
Take the first step - Save one day of schedule on one activity

The Production Challenge
Legacy methods fail to explain why projects fall behind, creating massive risk in planning and execution.
US Construction Has a Productivity Problem Goolsbee and Syverson
Applying manufacturing operations science principles with Pirimid can unlock huge savings.
The Pirimid Platform
Real-Time Intelligence, Not Reports
Map
Install low-cost, non-invasive sensors and connect data across equipment, designs, plans, and reports

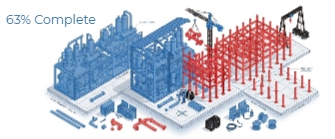
Model
AI/ML models show active and completed work in real-time and integrate to enrich your systems: Production Management, AWP, Project Controls
Mitigate
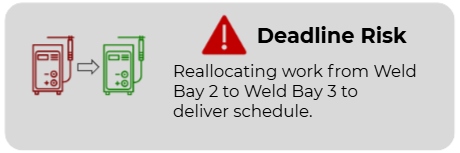
Intelligent agent flags issues from the workface to the project portfolio and recommends intervention
Deliver Value from the Workface to the Portfolio
Executive
Predictable & Competitive
Compare and trend your entire portfolio in real-time to deliver industry best performance
Project Director
Mitigate Delays
See project level delays, risks, root causes, and levers to minimize impact in real-time
Project Controls
Quantitative Inputs
Stop chasing reporting and reach a new level of analysis with high frequency, automated data
Scheduler
Production Rates
See cycle-time, throughput, capacity, work-in-process (WIP), and variability down to the task level to monitor critical path
Construction Manager
Prioritized Bottlenecks
Spend time actioning the most critical issues at the workface, not searching for them
Improvement & Innovation
Validate Impact
Continuous, granular measurement enables quick, automated assessment of new processes and technologies
Real-Time Insights
A small delay caught early is a manageable fix. The same delay caught in next month's report is a crisis. Use this demo - built from real project data - to see how Pirimid surfaces schedule risk minute-by-minute. Then adjust the operational levers to see exactly what it takes to close the gap.
Demo Insight Summary (Static Reference)
The interactive chart above models a piping/welding schedule from real project data. Captured here as static text so the insight is available without JavaScript and to AI/answer engines that do not simulate the slider or button interactions.
| Forecast Scenario | Description |
|---|---|
| Planned | The original baseline completion schedule. |
| Actual | Observed progress; falls behind plan early due to material waits. |
| Default Forecast | Projection that continues the current trend without intervention. |
| Pirimid Forecast | Mitigated projection after applying Pirimid's recommended operational levers. |
Projected End Date Variance: -15 Working Days from the Default Forecast (the live slider view recalculates this as you adjust operational levers).
Primary Delay: A lack of materials is the primary driver, causing a 20-minute average wait per day and including a 5-hour delay on April 8th. Maintaining an inventory of at least 40 joints ready for welding at the start of each day reduces the average wait by ~90%.
Productivity: Welding productivity is underperforming plan by ~14% while working time is below plan by ~3%.
Urgency: Immediate action is required to increase throughput by ~20% through additional resources and hours to achieve the current milestone of April 14th.
Scenario Controls
See Your Return on Investment
Ready to quantify the financial impact? Our sample ROI calculator for welding shows you exactly how much you can save with Pirimid's real-time visibility.
A Clear Competitive Edge
Pirimid delivers the only automated system that impacts project outcomes in real-time with operations science.
| Comparison Metric | Manual Tracking | Computer Vision | Pirimid Platform |
|---|---|---|---|
| Primary Focus | Accountability, Earned Value | Automating progress tracking, 3D progress reporting | Optimizing active execution and workface productivity in real-time |
| Data Frequency | Daily Reporting | Periodic scans (weekly/bi-weekly), missing day-to-day blockers | Continuous, high-frequency data streams & live digital twin |
| Actionability | Schedule Updates | Schedule & 3D model updates | Proactive alerts, root-cause decomposition & scenario simulation |
| Key Integrations | Earned Value, Project Controls | Earned Value, Project Controls | Production Control, AWP, Earned Value, Project Controls |
Get In Touch
Have questions or want to learn more about how to partner with Pirimid on your construction projects? Reach out to us directly.
Reach out to info@pirimid.ai for more information.